
Overview
B. A. D. consolidates data from multiple sources into a single visual interface. It enables teams to track KPIs, identify trends, and make faster, evidence‑based decisions. By transforming raw data into actionable insights, the dashboard supports doctors, administrators, and frontline staff in improving clinical and operational outcomes.
Access & Enablement
By default, all admin users have visibility access to the dashboard. If you are unable to see it, follow these steps to enable:
- Log in as an admin user.
- Navigate to User Groups.
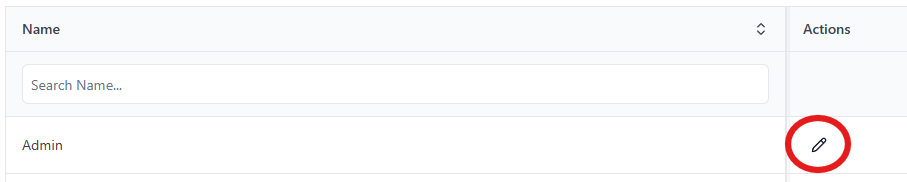
- Under the Admin User Group, go to the Actions column and click the pen icon to edit.
- Open the Permissions section.
- Tick Analytics (ensure both Dashboard and Read are selected).

- Save changes.
- Log out and log back in for the changes to take effect.
Purpose
- Monitor patient visits, revenue, and resource utilization.
- Support decision‑making with real‑time insights.
Features
- Operational Metrics
- Clinic volume, visit trends, hourly breakdown, patient flow, resource utilization.
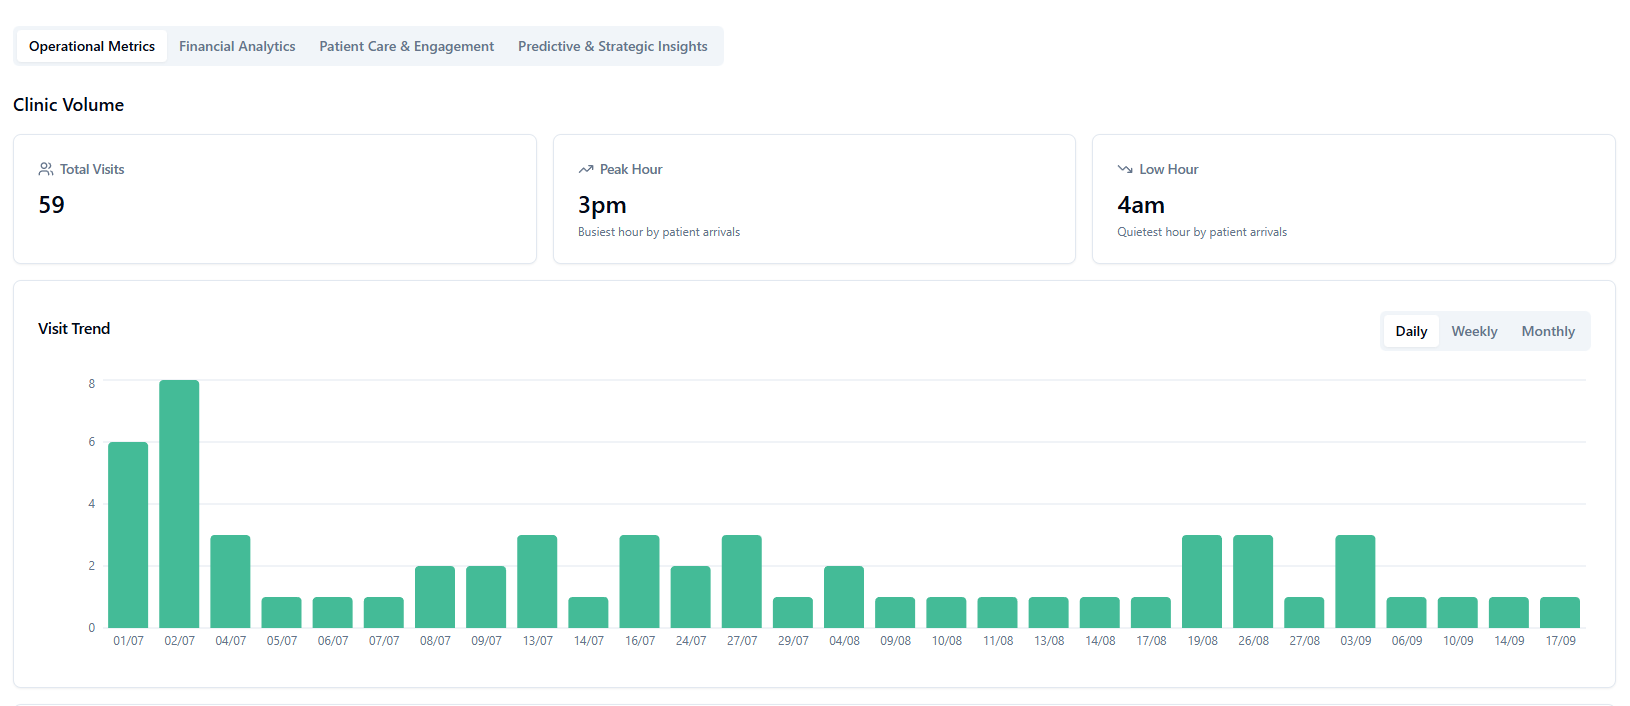
- Clinic volume, visit trends, hourly breakdown, patient flow, resource utilization.
- Financial Analytics
- Revenue tracking, revenue trends, payment methods, patient (self‑pay) vs panel, cost breakdown.
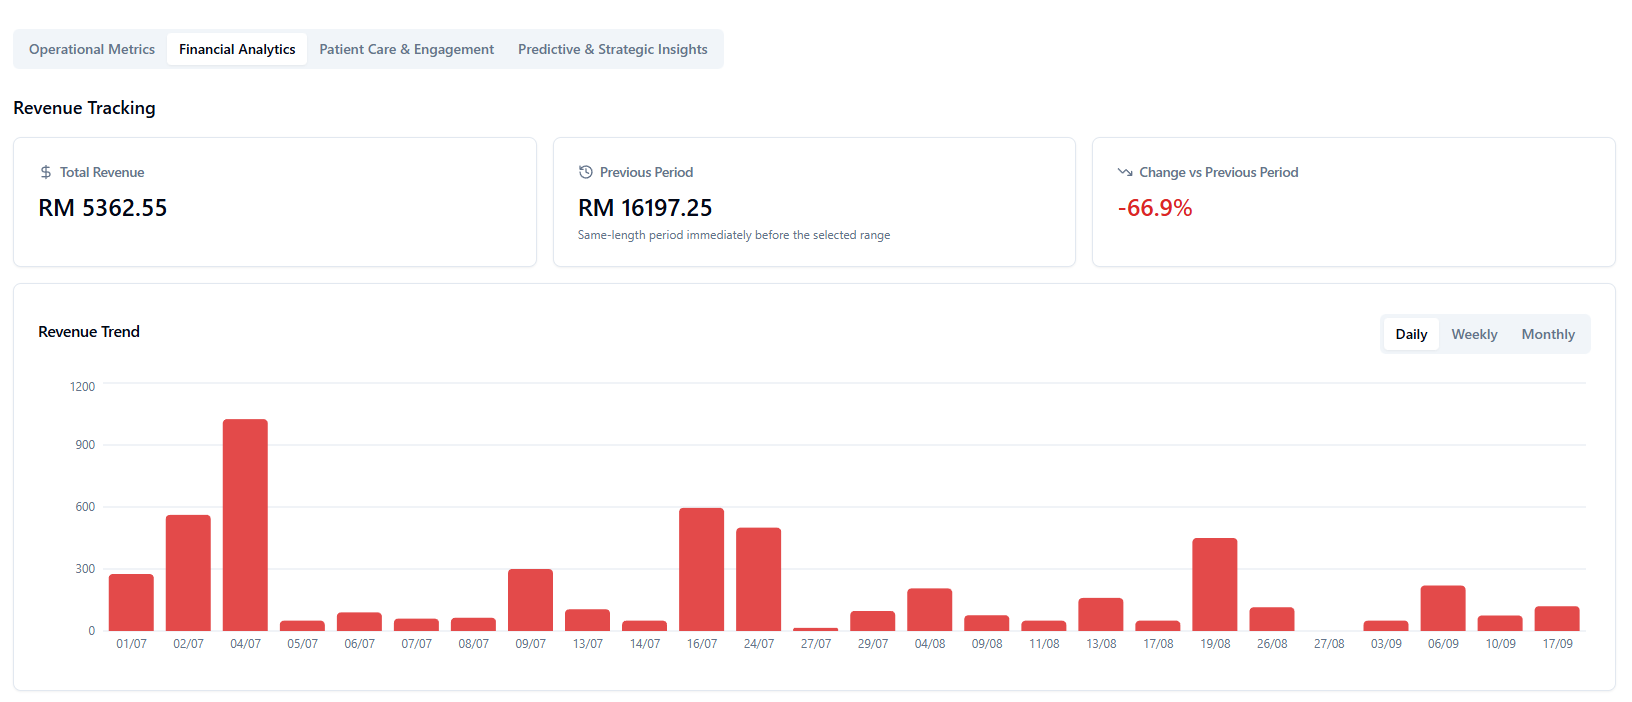
- Revenue tracking, revenue trends, payment methods, patient (self‑pay) vs panel, cost breakdown.
- Patient Care & Engagement
- Patient demographics, age breakdown, gender, nationality, treatment trends, patient retention, follow‑up compliance.
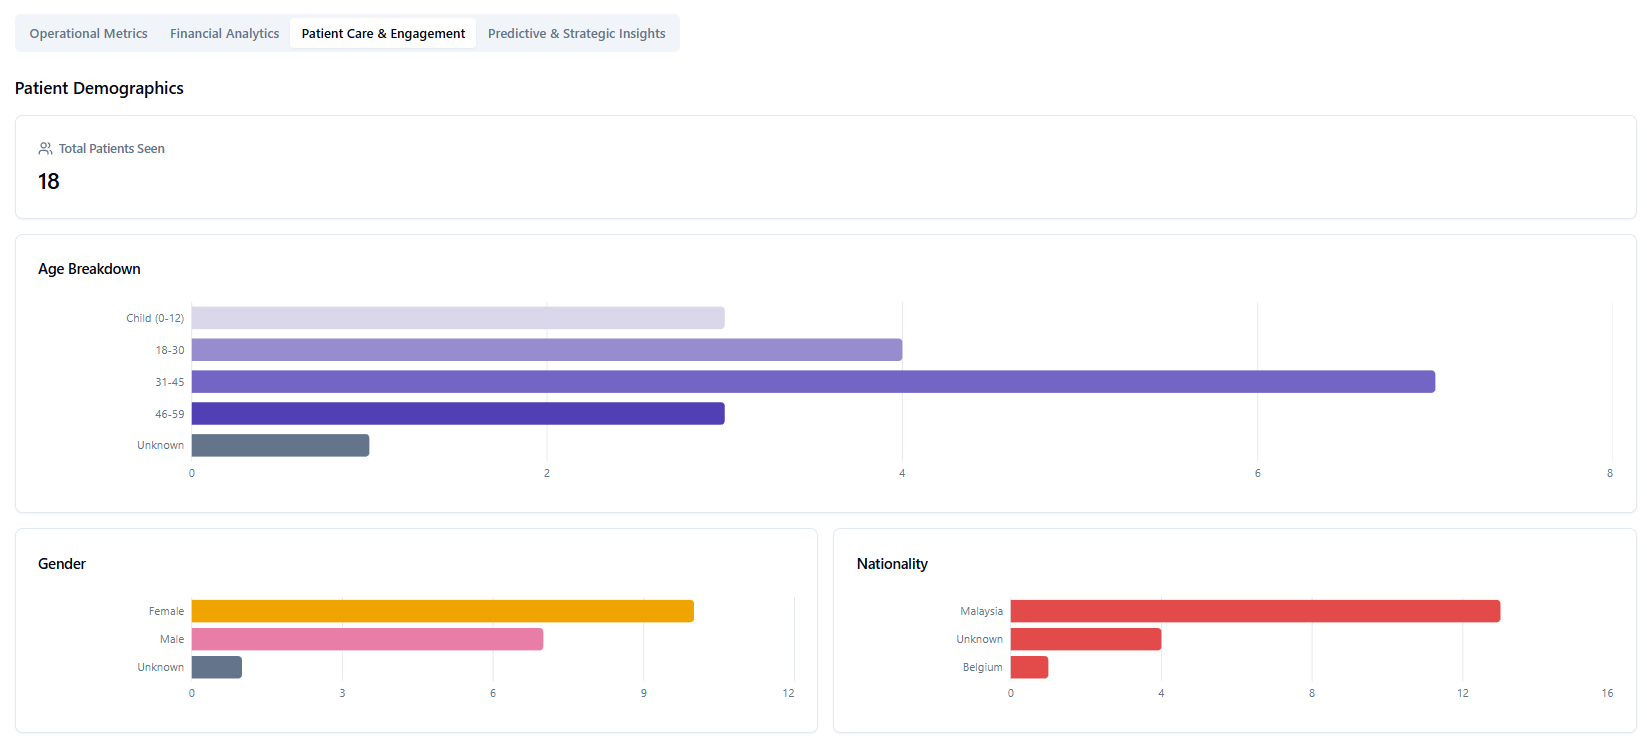
- Patient demographics, age breakdown, gender, nationality, treatment trends, patient retention, follow‑up compliance.
- Predictive & Strategic Insights
- Revenue forecast, peak hours pattern, growth metrics.
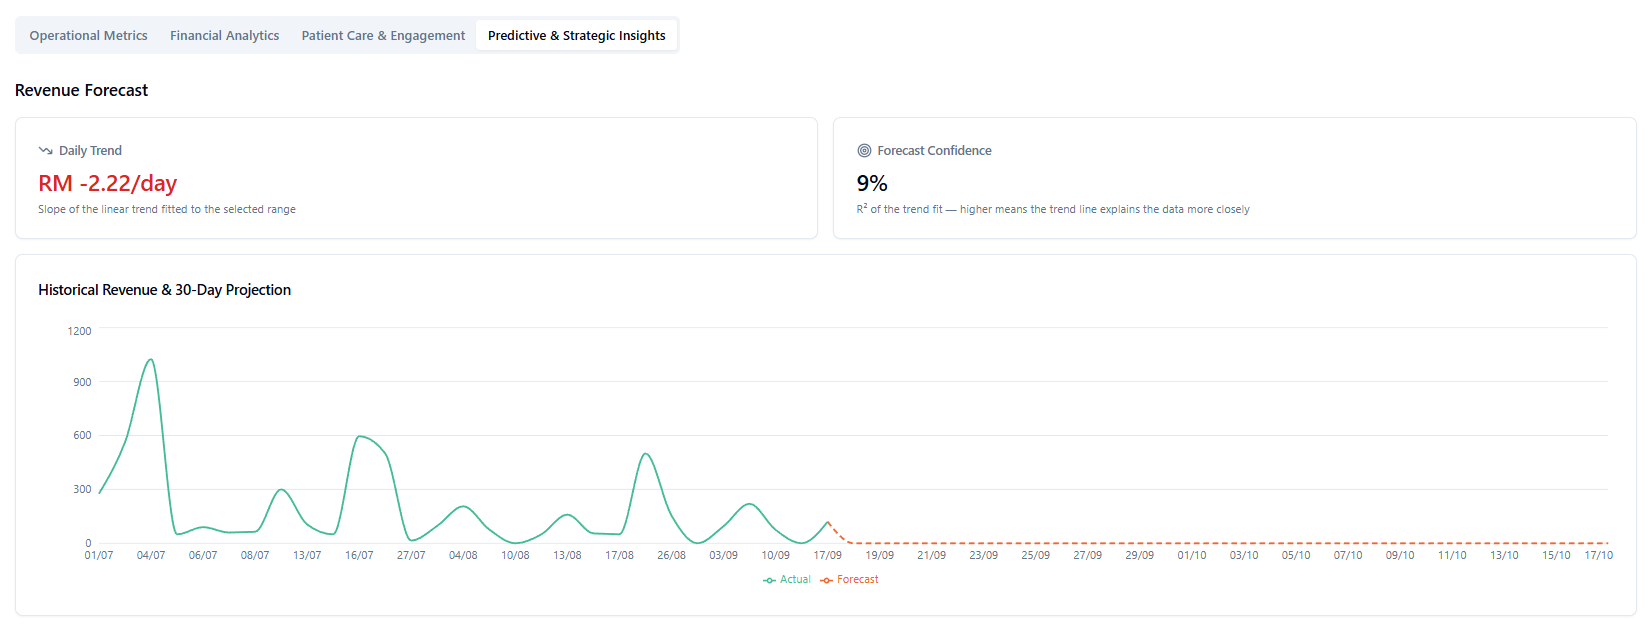
- Revenue forecast, peak hours pattern, growth metrics.
How to Use
- Log in to Klinify as an admin user.
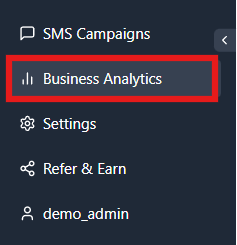
- Navigate to the Business Analytics tab.
- Select desired filters (e.g., by date).

Troubleshooting
- If the dashboard does not load, clear your browser cache.
- For further assistance, contact Klinify Support at our Live Chat Support or mail to support@klin.freshdesk.com